
Behind the deforestation – A INPE/UFMG partnership to demystify deforestation processes through spatial analyses and modeling
Since March 2020, a group of researchers from INPE and UFGM have been collaborating to generate sound information to support deforestation control actions in the Brazilian Amazon, initially aiming at “flattening” the 2020 deforestation curve. Through this site, we will make the core results of such analyses available to a broader community, including input, intermediary and final products. Unfortunately, the deforestation process in 2020 has evolved so far as intense as in 2019. But we believe Brazil has proven possible to control deforestation in the past through concerted actions of the government, business and civil society, backed by sound science and the most reliable satellite monitoring systems in the world. Shredding light to the social processes underlying the available data is the first and essential step to win this new battle.
Topic 1: Who is deforesting and burning the Brazilian Amazon?
Last updated on August 20th, 2020
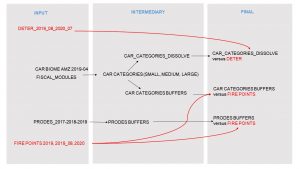
Combining information from INPE´s remote sensing monitoring systems (DETER, Queimadas and PRODES) to rural cadastral properties (CAR), as illustrated in Figure 1, we investigated two questions:
- Are small-holders responsible for most of the recent deforestation, as observed by the DETER system, and the active fire alerts (evidence of ongoing hot spots), as observed by the Queimadas system, in the Brazilian Amazon Biome?
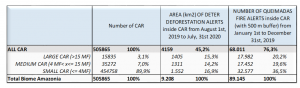
The answer is NO, as Table 1 summarizes. Considering the area of deforestation alerts as observed by INPE´s DETER system during the previous 12 months (from August 2019 to July 2020) that happened in areas with auto-declaratory rural cadastral registry (CAR), 67% happened in large to medium farms (i.e. more than 4 fiscal modules). Similarly, comparing the hotspots (evidence of ongoing fires) observed by INPE´s QUEIMADAS system (6), based on MODIS satellite data, in 2019 (January to December) in areas with CAR, 52% can be attributed to large and medium properties.
2. Which percentage of the fire hotspots identified by the Queimadas system can be linked to recent deforestation processes?
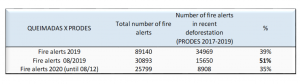
39% of the hotspots identified in 2019 for the Brazilian Amazon biome can be attributed to areas recently cleared (PRODES 2017-2019). But when you take August 2019, this percentage is 51%.
A synthesis of the results will be available at Aguiar, Rajão et al, “Who is deforesting and burning the Brazilian Amazon?” (under review). Our results reinforce the conclusions of other studies conducted by IPAM and NASA.
Methods and Data
We performed a series of spatial analysis to answer these questions, summarized in the tables and figure below. All the input, intermediary and final layers are available for download at: https://drive.google.com/drive/folders/1ySvdwMbeUoUoSghd6hGNaZIIBUccTbWH?usp=sharing
General information:
- All layers cover the Brazilian Amazonia Biome, area available as shapefiles, projection Brazil Polyconic – EPSG:5880 – SIRGAS 2000.
- The files are organized in three folders (input, intermediary and resulting spatial layers): Groups of related files are zipped together, as described below. We also provide a synthesis_table.xls for download.
- To use the files, please cite Bezerra, F.G.S.; Pacheco, R, Aguiar A.P.D.; Rajão, R. Almeida, C.. Data files for the analysis of fire and deforestation data in 2019 and 2020. Available at: this site. License: CC-BY.
- We will also make it available to PANGEA https://www.pangaea.de/ but the process takes some weeks. We will include the links when available.
Input layers folder:
Layer group (zip) |
Description |
Source |
CAR_BIOME_AMZ_APRIL_2019 |
Cleaned version of the Rural cadastral registries (CAR) (clipped to the biome, topological errors, removal of duplicate geometries and attributes, of invalid geometries, of cancelled registres, counting of superpositions and removal when larger than 10), downloaded from the SICAR in April 2019.Final number of registries: 505865 |
SFB SICAR: http://www.car.gov.br/#/
|
FISCAL_MODULES |
Information about the size of the INCRA fiscal module (FM) for each municipality in the Brazilian Amazon. Spatial data generated by UFMG. |
INCRA http://www.incra.gov.br/pt/modulo-fiscal.html
|
DETER_2019_08_2020_07
|
Deforestation alerts as observed by the INPE´s DETER System (classes clear-cut deforestation, deforestation with vegetation and mining) from August 2019 to July 2020, clipped to the Amazon Biome.Total area: 9208 km2. |
Terrabrasilis – Geographic Data Platformterrabrasilis.dpi.inpe.br
|
FIRE_POINTS
|
Active hotspots observed by the INPE QUEIMADAS system (Reference Satellite, AQUA_M-T (sensor MODIS).Layer 1 (2019): 2019-01-01 to 2019-12-31Layer 2 (August, 2019): 2019-08-01 to 2019-18-31Layer 3 (2020): 2010-01-01 to 2020-08-12Note about resolution: Each point/alert means that an active fire was identified in an area of 1 x 1 km2 around the point. Because of this, the data is not directly comparable to the CAR or DETER polygons. We created buffers of 500 meters, see below. |
QUEIMADAS PORTAL: http://queimadas.dgi.inpe.br/queimadas/portal
|
PRODES_2017_2018_2019
|
Newly deforested areas according to INPE´s PRODES 2017, 2018 and 2019 (August 2016 to July 2019). |
Terrabrasilis – Geographic Data PlatformTerrabrasilis.dpi.inpe.br
|
Intermediary layers folder:
Layer group (zip) |
Description |
Processing |
CAR_CATEGORIES |
Three layers separating the CAR registries into SMALL (less than 4 FM), MEDIUM (larger than 4 FM and smaller than 15 FM) and LARGE (greater than 15 FM). |
Combining CAR_2019 and FISCAL_MODULES for each municipality, each car was classified as SMALL, MEDIUM and LARGE, and separated into 3 layers. |
CAR_CATEGORIES_DISSOLVE |
To avoid double counting (of deforestation and fire points) in each category, we dissolved the layers. We cleaned the CAR data, but did not resolve all the inherent inconsistencies (such as multiple registries in the same area) in the data. |
Dissolve in each category. |
CAR_CATEGORIES_BUFFERS |
For each CAR layer, for each category, we created three spatial partitions: an external buffer of 500 m, an internal buffer of 500 m and the remaining internal area. We did that because the QUEIMADA System reference satellite captures a hot spot in an area of 1 x 1 km2 around the point. This allows us to compare the disparate spatial resolutions (and assess the uncertainty). |
Dissolving the CAR registries, and generating 3 layers for each category (an external buffer of 500 m, an internal buffer of 500 m and the remaining internal area) |
PRODES_BUFFERS |
Idem |
Dissolving the PRODES polygons, and generating 3 layers (an external buffer of 500 m, an internal buffer of 500 m and the remaining internal area). |
Resulting layers folder:
Layer group (zip) |
Description |
Processing |
CAR_CATEGORIES_versus_DETER
|
Total area of deforestation (according to DETER_2019_2020) in each CAR category (SMALL, MEDIUM AND LARGE)
|
Erase of DETER_2019_2020 in each CAR_CATEGORIES, and area calculation. |
CAR_CATEGORIES_BUFFERS_versus_QUEIMADAS
|
Count of the number of hotspots in each buffer partition for each CAR category. Repeated for FIRE_POINTS_2019. and FIRE_POINTS_2020 |
Count point in polygon(9 output layers per period) |
PRODES_BUFFERS_versus_QUEIMADAS
|
Count of the number of hotspots in each buffer partition. Repeated for FIRE_POINTS_2019. and FIRE_POINTS_2020 |
Count point in polygon(3 output layers per period) |